[5051] Power 인덱스차트
우측툴바
개요
다양한 툴바를 이용하여 차트 내에서 분석도구로 활용
사용방법
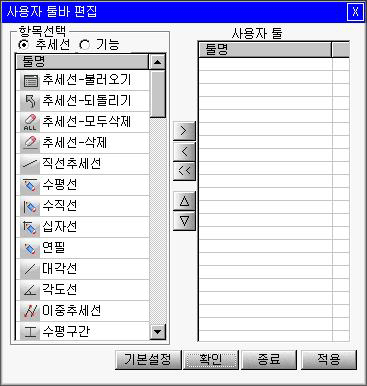
- A:추세선분석 F:기능툴바 U:사용자툴바
- 추세도구불러오기
- 되돌리기
- 추세선모두삭제
- 추세선 삭제
- 직선추세선
- 수평선
- 수직선
- 십자선
- 연필
- 대각선
- 라인앵글
- 이중추세선
- 수평구간
- 수직구간
- 이중구간
- 가격 - 구간
- : 추세선도구 저장 목록
- : 마지막 작업 취소
- : 추세선 전부 지우기
- : 선택한 추세선 지우기
- : 기본추세선 그리기
- : 수평추세선 그리기
- : 수직추세선 그리기
- : 십자추세선 그리기
- : 자유추세선 그리기
- : 30, 45, 60, 300, 315, 330 ˚ 선 그리기
- : 자유각도선 그리기
- : 기본추세선과 평행한 선 그리기
- : 수평의 평행선 그리기
- : 수직의 평행선 그리기
- : 이중추세선과 평행한 구간선 그리기
- : 두 점 사이의 가로와 세로 값 비교
- 가격 - 차이
- 가격 - 변화
- 피보나치 아크
- 피보나치 팬라인
- 피보나치 수평 조정대
- 피보나치 수직 조정대
- 피보나치 시간대
- 피보나치 목표치
- 앤드류 피치포크
- 사이클구간
- 간라인
- 간앵글
- 간팬
- 간조정대
- 가속저항 호
- 가속저항 팬라인
- 사각형
- : 두 지점 사이의 가격 차이 비교
- : 두 지점 사이의 가격 변화 비교
- : 최고점과 최저점을 기준으로 23.6%, 38.2%, 50.0%, 61.8% 등의 반원으로 비교
- : 최고점과 최저점을 기준으로 23.6%, 38.2%, 50.0%, 61.8% 등의 선으로 비교
- : 피보나치 수열로 수평선을 그려 비교
- : 피보나치 수열로 수직선을 그려 비교
- : 피보나치 수열인 1, 1, 2, 3, 5... 의 수로 수직선을 그려 시간적인 분석
- : 세 점을 찍어 피보나치 수로 세점을 연결한 직선을 그려 분석
- : 하락의 마지막 구간과 상승의 마지막 구간을 이어 추세 분석
- : 반복된 시간대의 구간을 비교
- : 시세의 기울기를 비교
- : 45도의 직선과 90도 반대 방향의 45도 각도의 직선들을 연속으로 배열
- : 두 점 사이의 피보나치 수열에 의한 시간대별 방사선 분석
- : Gann 비율에 따라 구간 최대/최소 값을 분할
- : 주가의 상승이나 하락폭의 피보나치 비율로 조정하여 비교
- : 피보나치선의 확대한 개념으로 피보나치선과 같은 방법으로 비교
- : 사각형을 그린다.
- 타원
- 원
- 삼각형
- 글상자
- 도형삽입
- 엘리어트파동 2점
- 엘리어트파동 3점
- 직선회귀선
- 직선회귀채널
- 표준편차
- 표준오차
- 목표수익률
- 스탑로스
- 삼등분선
- 사등분선
- 캔들라인
- 캔들그리기
- 조정백분율
- 캔들정보
- 구간정보
- 연속직선
- 신호표시
- 자동추세선
- 전환선
- 전환팬
- 실버룰
- 배가법
- 목표치
- 목표치
- 일목시간간격
- : 타원을 그린다.
- : 원을 그린다.
- : 삼각형을 그린다.
- : 글상자를 그린다
- : 도형을 삽입한다.
- : 두개의 점으로 엘리어트 파동선을 그린다.
- : 세개의 점으로 엘리어트 파동선을 그린다.
- : 가격차트의 고점과 저점을 연결하여 영역안의 평행선을 표시한다
- : 가격차트의 고점과 저점을 연결하여 영역내 저항선, 지지선, 추세선으로 분석
- : 두 지점간의 표준편차를 표시합니다.
- : 두 지점간의 표준오차를 표시합니다.
- : 현재위치의 종가와 상하 15%의 지시선과 종가와 선택위치의 비율을 표시합니다.
- : 현재위치의 종가와 선택한 위치의 비율차이 및 기타 위치를 표시합니다.
- : 두 지점간 차이의 0, 25, 50, 75% 비율에 해당하는 값을 표시합니다.
- : 두 지점간 차이의 0, 33.3, 66.7% 비율에 해당하는 값을 표시합니다.
- : 선택한 봉의 수치를 표시합니다
- : 시가와 종가를 가지는 캔들을 그립니다.
- : 세개의 지점을 선택하여 지점간 조정비율을 표시한다.
- : 선택한 봉의 정보를 표시한다.
- : 선택한 구간의 시가 고가 저가 종가를 표시한다.
- : 연속한 지점의 가격 등락율 거래량 등을 표시한다
- : 선택한 지점에 신호를 표시한다.
- : 가격변화에 따른 자동추세선 표시
- : 가격변화에 따른 전환선 표시
- : 가격변화에 따른 전환선과 미래의 가격 구간을 표시
- : 실버룰을 적용한 추세선
- : 배가법을 적용한 추세선
- : ENV 목표치 계산
- : NT 목표치 계산
- : 일목시간 간격 표시
- F:기능툴바
- 초기화
- 환경설정
- 지표설정
- 수식관리자
- 좌우수치조회
- 기본수치조회
- 데이터그리드
- 툴팁-텍스트
- 툴팁-상세보기
- 툴팁-돋보기
- 구간확대
- 차트저장/로딩
- 십자수치항상표시
- 십자수치드래그
- 최고최저가표시
- 주가우선스케일
- 영역중첩
- 최고최저가표시
- 최고최저가라인
- 상한하한표시
- : 차트 초기화
- : 환경설정 팝업
- : 가격이동평균선 등 차트에 표시되는 지표설정
- : 지표에 대한 계산식 관리
- : 자동으로 위치를 잡는 조회창 생성
- : 기본 수치 조회창 생성
- : 데이터 그리드 생성
- : 텍스트 툴팁을 보여준다.
- : 상세보기 툴팁을 보여준사
- : 돋보기 툴팁을 보여준다.
- : 마우스 좌측드래그로 확대/축소한다
- : 현재 차트 설정을 저장/로딩
- : 마우스 커서와 함께 십자수 항상 표시
- : 마우스 드래그 시 십자수 표시
- : 최저가 최고가 표시
- : 화면에 보이는 봉의 최대/최소 값과 Y축 일치
- : 같은 프레임의 다른 영역을 중첩한다.
- : 최고/최저가 표시
- : 최고/최저가 라인 표시
- : 상/하한가 표시
- 이미지저장-파일
- 이미지저장-클립보드
- 데이터저장-파일
- 데이터저장-클립보드
- 데이터불러오기-파일
- 데이터불러오기-클립보드
- 전환점/자동추세선
- 위치알림선보기
- 타이틀보기/감추기
- 스크롤바보기/감추기
- 스크롤바자동보기
- 스크롤바위치동기화
- 스크롤바설정
- X축보기/감추기
- Y축보기/감추기
- 일주월분차트
- 일주월차트
- 분초틱차트
- : 차트의 이미지를 파일로 저장한다.
- : 차트의 이미지를 클립보드로 저장한다.
- : 차트의 데이터를 파일로 저장한다.
- : 차트의 데이터를 클립보드로 저장한다.
- : 파일의 데이터를 차트로 불러온다.
- : 클립보드의 데이터를 차트로 불러온다.
- : 전환점/자동추세선 표시
- : 기준선을 보여준다
- : 타이틀바를 보이거나 감춘다.
- : 스크롤바를 보이거나 감춘다.
- : 마우스 커서를 스크롤바로 가져갔을 때에만 스크롤바 표시
- : 분할영역의 체크한 종목에 대한 스크롤바 위치 동기화
- : 스크롤바 환경설정
- : X축을 보이거나 감춘다.
- : Y축을 보이거나 감춘다.
- : 한종목을 일주월분으로 분할 분석
- : 한종목을 일주월으로 분할 분석
- : 한종목을 분초틱으로 분할 분석
- - 데이터 그리드


- 데이터고정, 데이터수정, HTML저장, 텍스트저장, 클립보드저장, 엑셀저장
 사용자 툴바 위저드
-

위 추세선과 기능 툴바의 항목들을 편집하여 사용자 툴바에 등록할 수 있다.
사용방법
개요
추세선을 이용하여 분석
목록 : LINE Trend, LINE Horizon, LINE Vertical, LINE Cross, LINE Free, LINE Diagonal, LINE Angle, SAME Trend, SAME Horizon, SAME Vertical, SAME Equiv, DIFF Cross, DIFF Value, DIFF Time, FIBO Arc, FIBO Fan, FIBO HRetrace, FIBO VRetrace, FIBO TimeZone, ANDREW Pitch fork, TIME Cycle, GANN Line, GANN Grid, GANN Fan, GANN Retrace, SPEED Arc, SPEED Fan, SHAPE Rect, SHAPE Ellipse, SHAPE Circle, SHAPE Triangle, TEXT String, SYMBOL List, ElliotWave 2Points, ElliotWave 3Points, LinearRegression, RaffRegression, STandard Devivation, Standard Error, TargetProfit, StopLossLoss, Quardrant, TironeLevels, CANDLE Line, CANDLE Rect, ADJUST Ratio, NFO Candle, NFO Region, NFO Points, NFO SIGNAL
개요

-
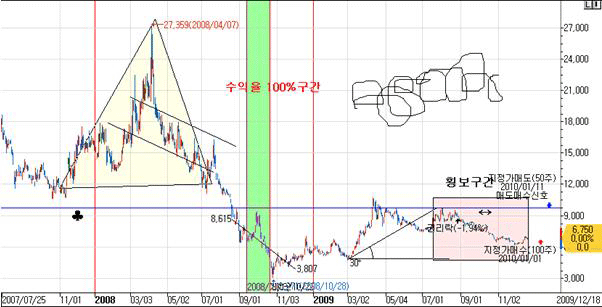
도형 – 삼각형,사각형
평행선,연필,각도추세선,선형회귀선,심볼,
매수,매도추세선
텍스트,수직구간표시

-
수평구간 – ex:최대,최소구간표시
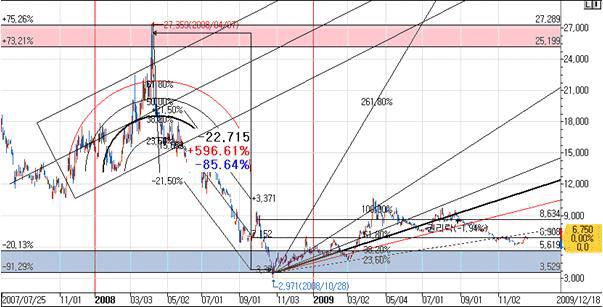
앤드류피치포크,최대최소구간분석,
피보나치 호,팬
선형회귀선 채널
